
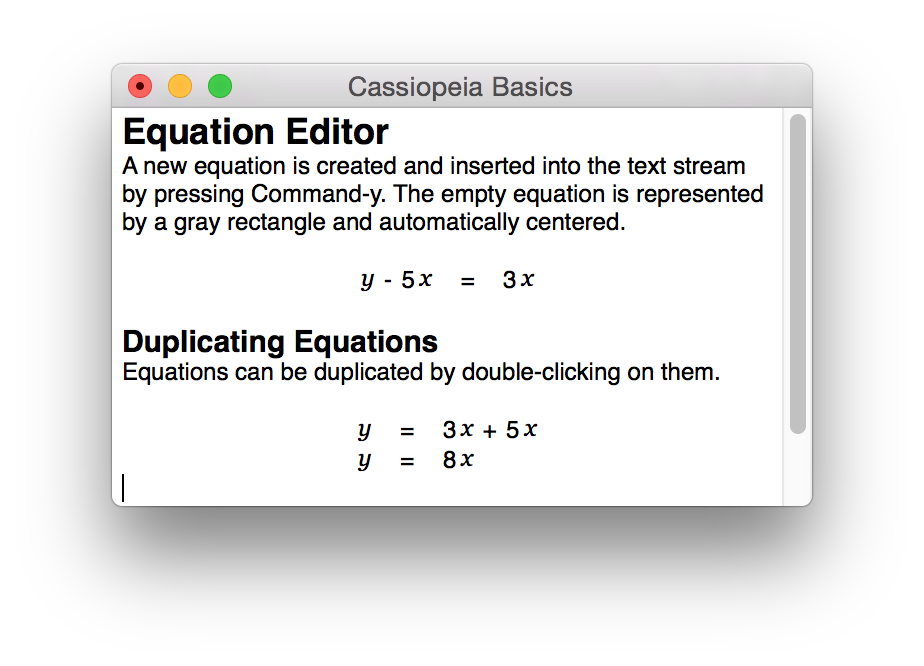
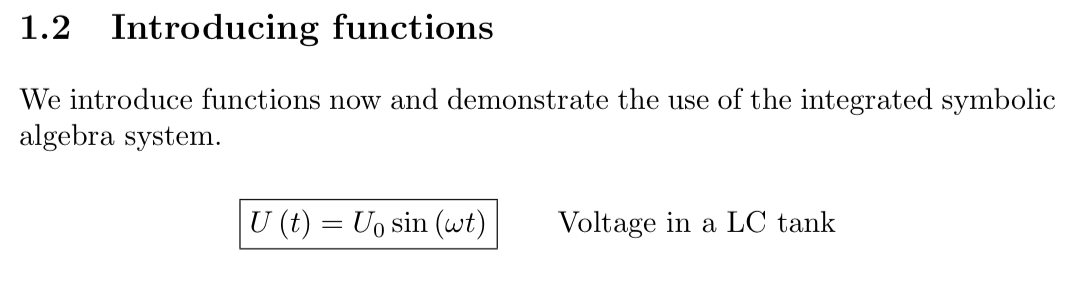
Equation Editor
One of the most important objectives for the development of Cassiopeia was to provide a text processing solution with a highly integrated equation editor with the following properties:- keystroke based editing of equations (highly efficient)
- nice presentation on screen for on-screen thinking
- LaTeX export for publishing in book printing quality
- MathML content markup based internal representation
- built-in 2D graph module for immediate plotting of functions
- built-in symbolic algebra system for equation simplification
Beautifully rendered equations (WYSIWYM) invite scientists and engineers to use Cassiopeia not only as a word processor for preparing stunning publications but also as a think tank tool in the creative process.
LaTeX export is an absolute must for a scientific wordprocessing solution. However, LaTeX is a typesetting language developed for the printing industry to improve the quality of printed publications. It was never meant to be directly used by authors in the content creation phase. Scientists should be able to concentrate on scientific problems instead of spending valuable time on tinkering around with typesetting tags. That's why Cassiopeia hides the LaTeX generation and compilation process as much as possible. Cassiopeia users can influence the LaTeX generation process - e.g. by providing an alternative preamble or inserting pure LaTeX code into the document - but they usually don't have to. Cassiopeia generates stunning output with its default settings and predefined LaTeX preambles.
LaTeX is a description language with focus on presentation. That's fine if the only goal of the authoring process is to get a PDF in book printing quality. However, if functions are to be plotted, if equations are to be processed by a symbolic algebra system another internal representation is needed that precisely describes the mathematical meaning of an equation. That's what MathML content markup was developed for (see W3C Recommendation from October 21st 2003) and why Cassiopeia uses this standard to internally represent formulas.
There are a bunch of graph applications available on the market that can be used to generate a plot for a given function. The exported image files can then easily be imported into any textprocessing system. This might be a viable approach for simple functions but is not practicle for more complex ones with lots of terms and coefficients. Uninterrupted scientific thinking means to simply shift-doubleclick on an entered or automatically derived function in the textprocessing system and get a plot immediately inserted into the text stream.
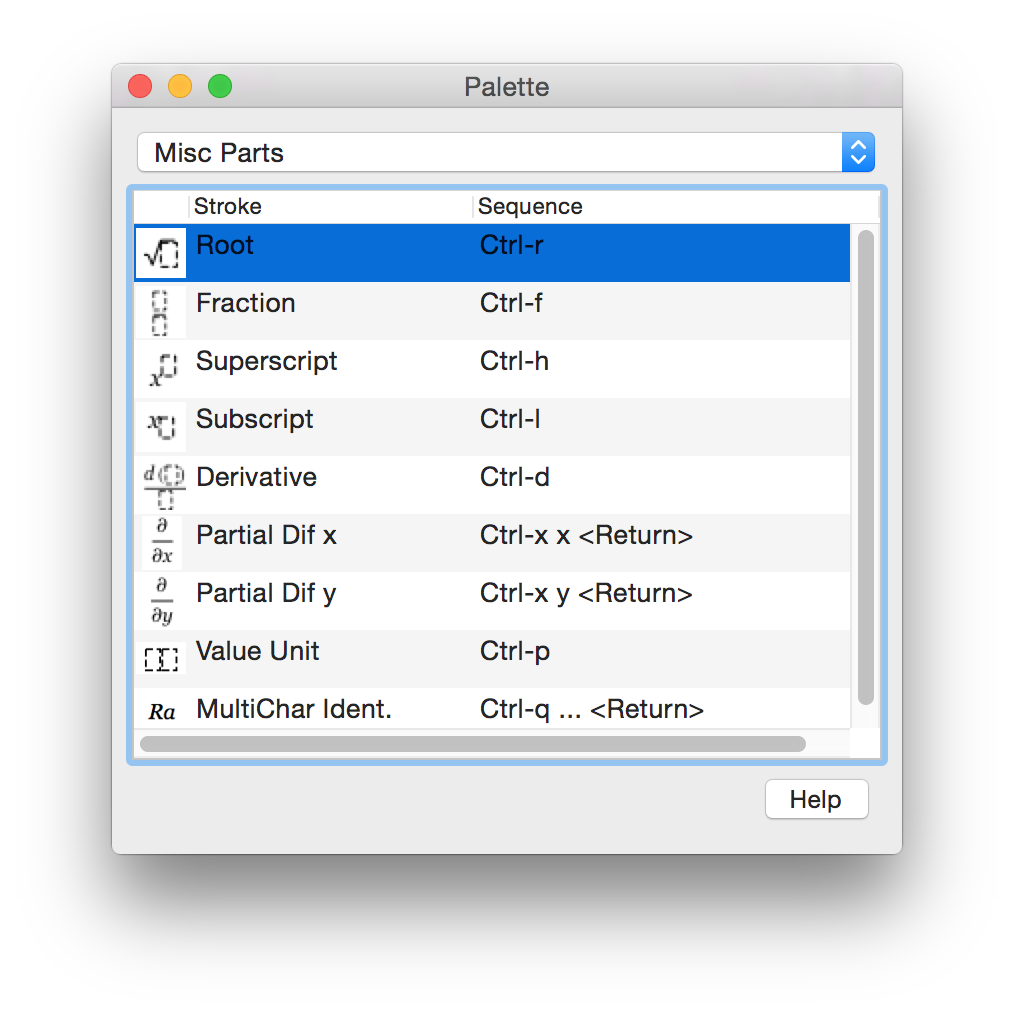
A palette allowing to easily lookup key strokes or directly insert parts and symbols into the document by double-clicking on a palette entry can be opened with Command-Shift-P. Note, double-clicking on an entry of the palette has an effect in formula mode (Command-y) only.
 |
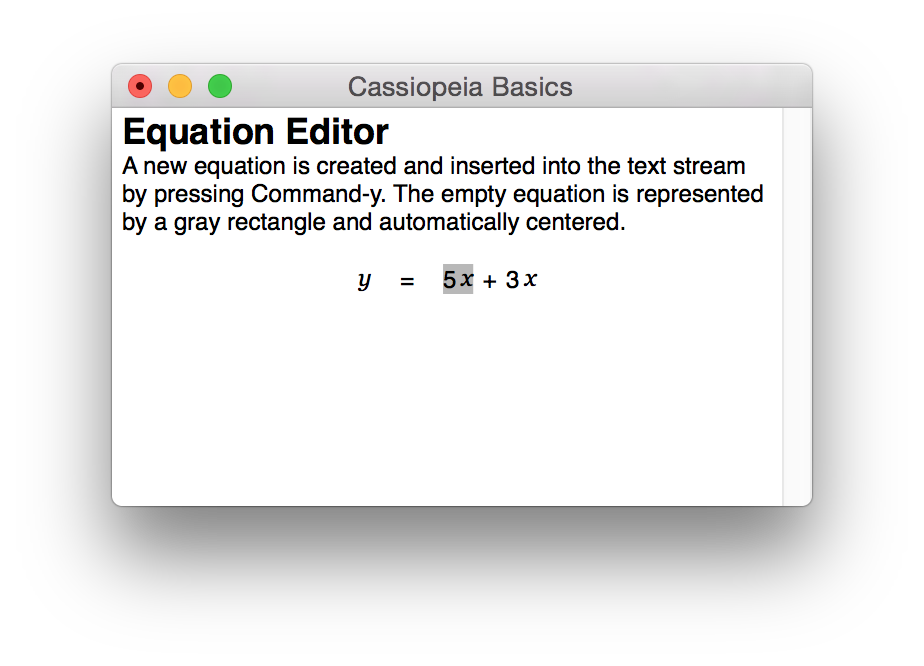
Natural editing of equations
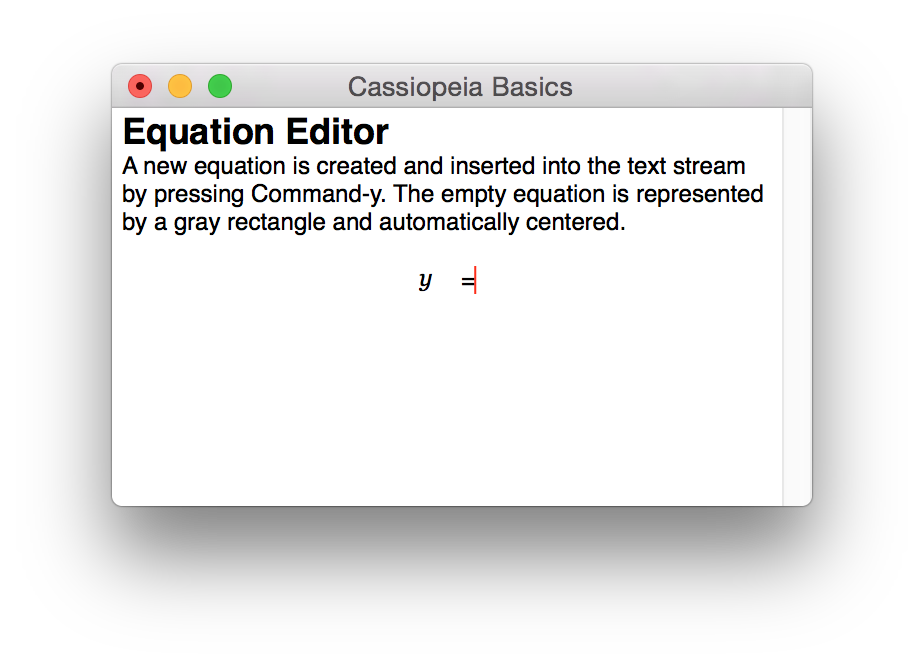
Open any Cassiopeia document press Enter once or twice to place the cursor on a new line and then press Command-y to create a new equation. |
 |
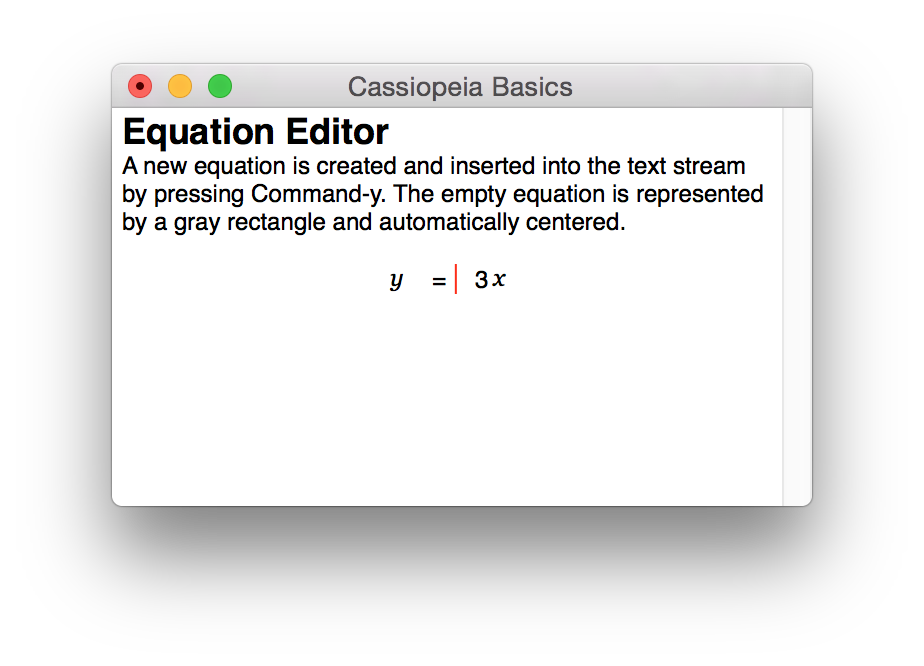
Enter two more charaters: "3", "x". Hit <Return> or Esc to leave formula mode.
 |
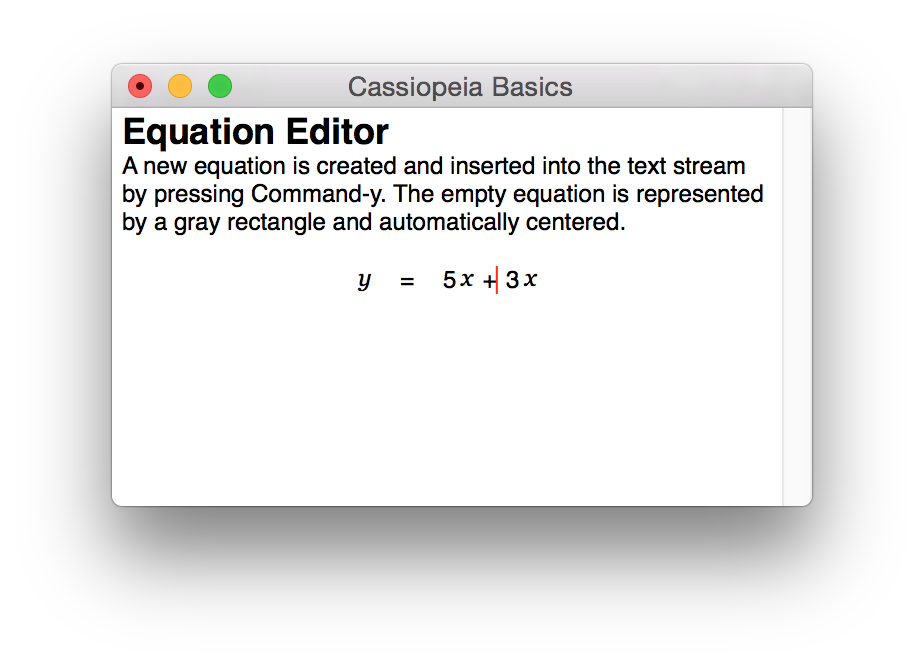
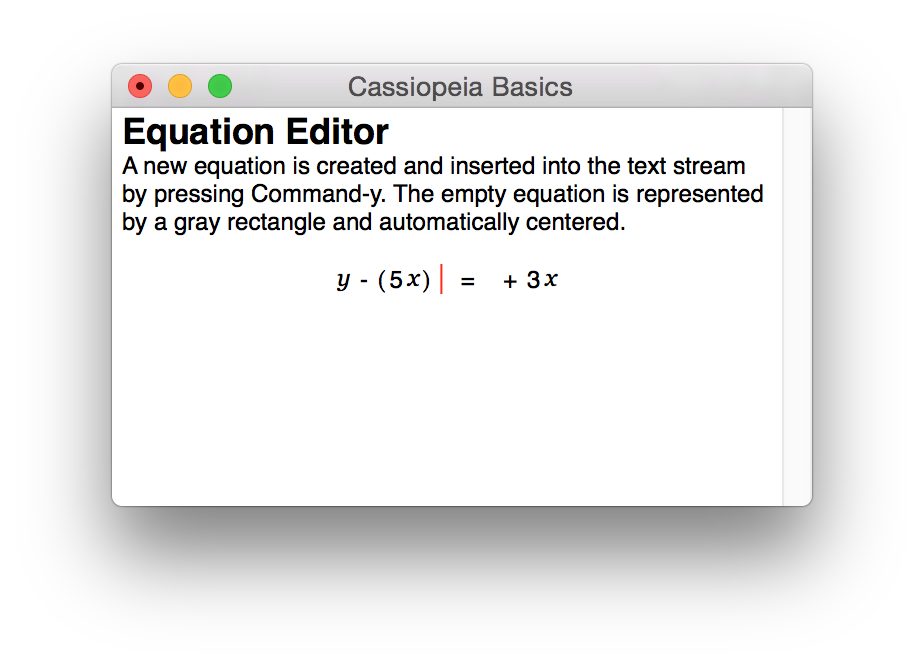
Now press the left cursor key until the cursor is located directly behind the equation. Then press the left cursor key once again.
 |
 |
 |
 |
 |
Press Command-x to cut out the 5x. Then press the cursor left key twice to move to the left of the equation sign, enter - and then press Command-v to paste.
 |
 |
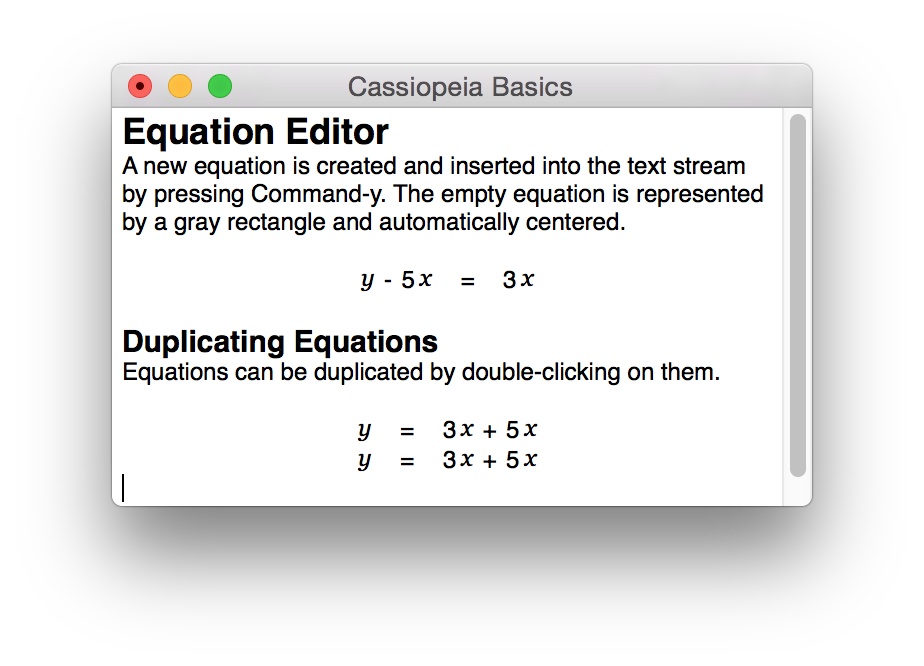
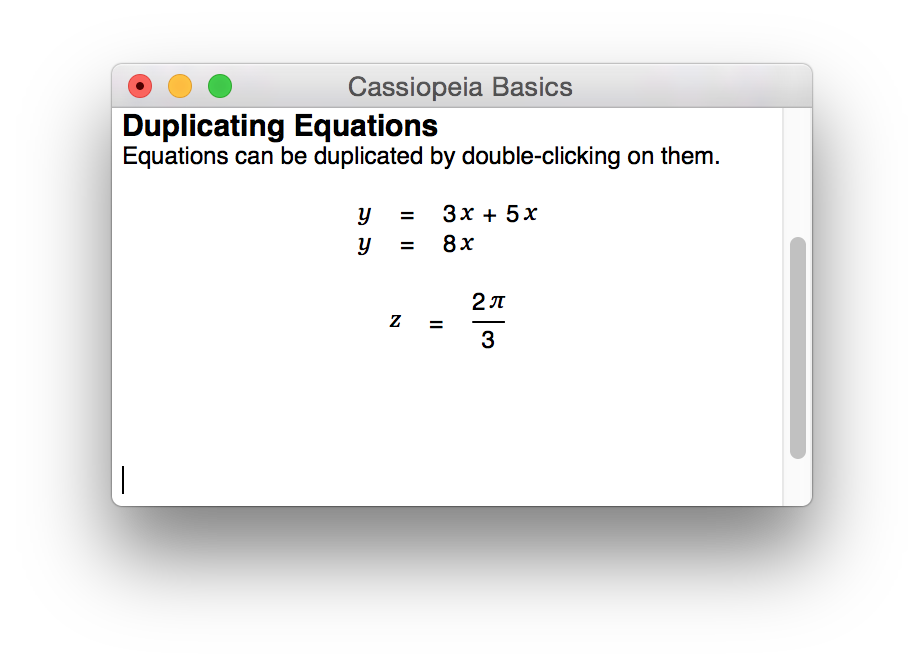
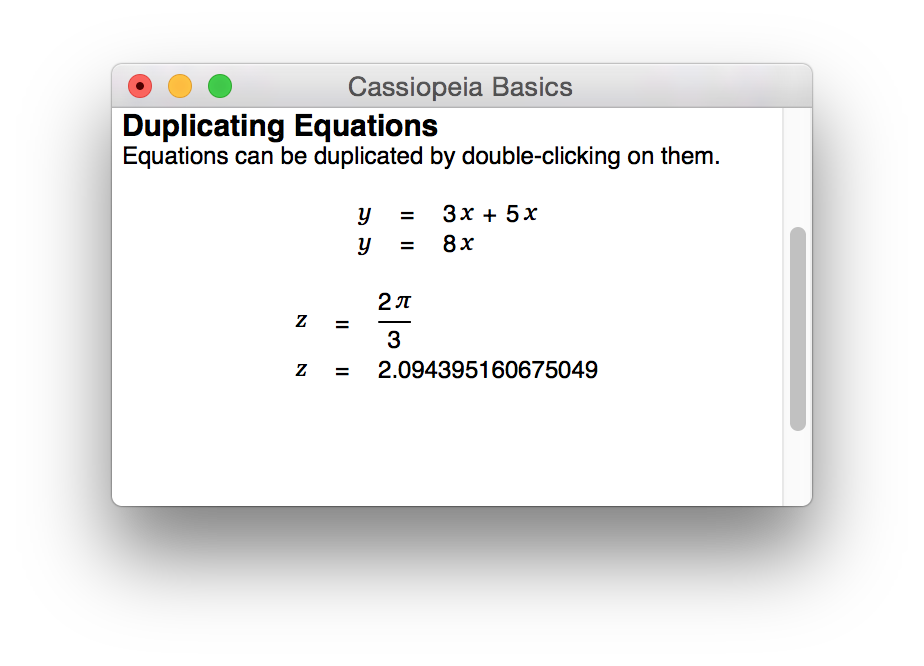
Duplicating and simplifying equations
Place the cursor on an empty line and press Command-y to create a new equation. Then reenter the equation from the last section by typing naturally.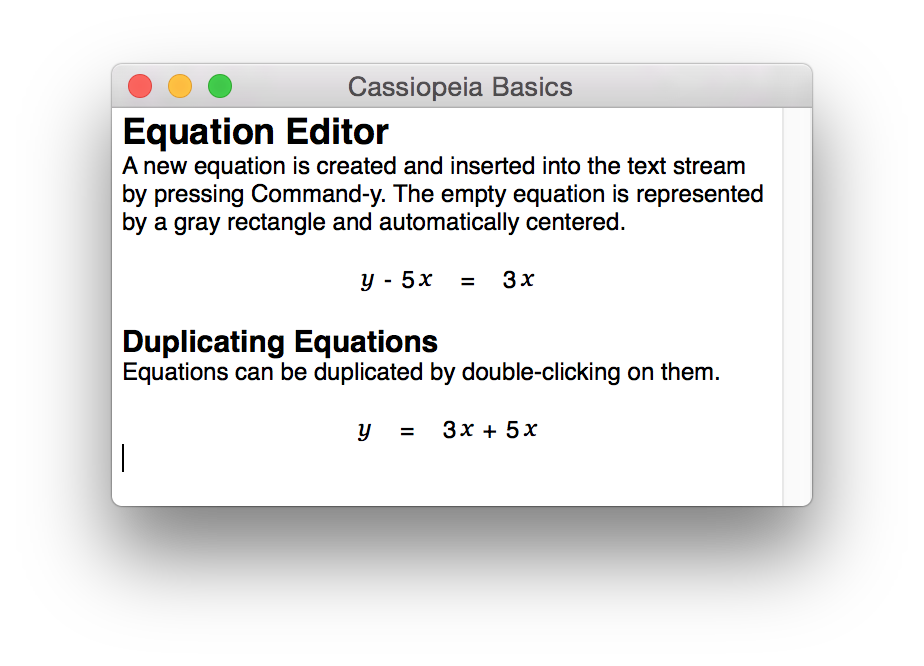 |
 |
 |
 |
 |
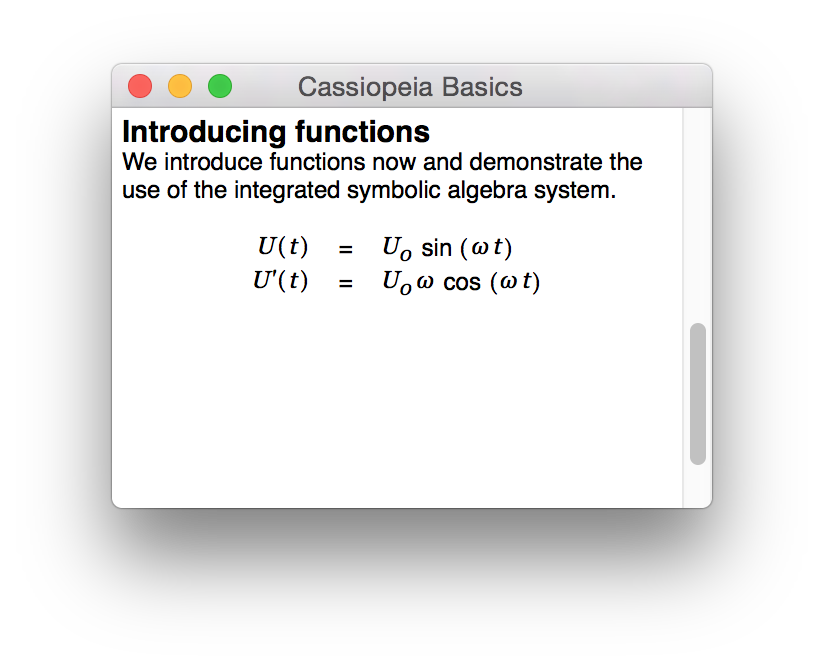
Introducing the equation inspector
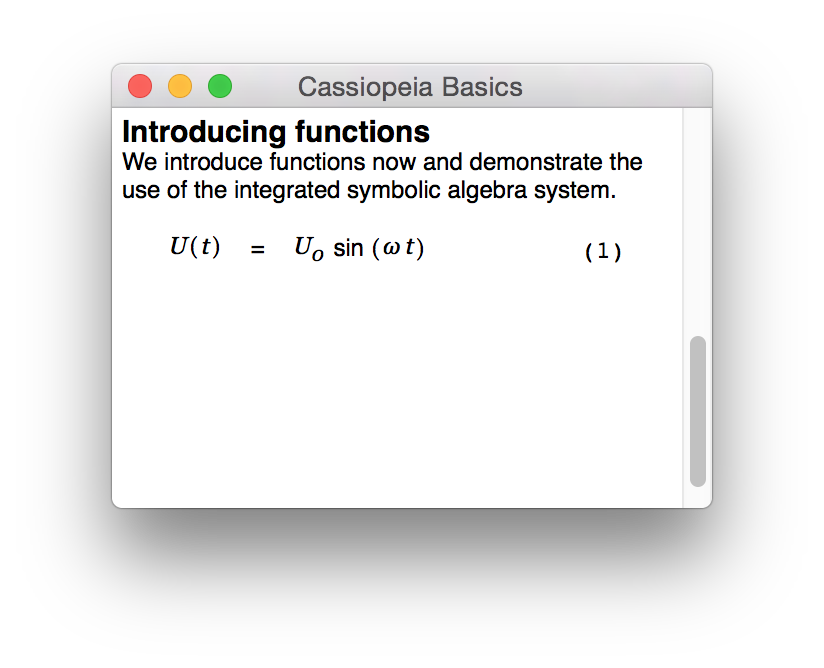
We introduce the equation inspector now and make more use of the integrated symbolic algebra system. Create a new equation with Command-y and type: U, (, t, ), =, U, Ctrl-l 0, <Cursor-up>, <Cursor-right>, s, i, n, Ctrl-g, w, t <Return>.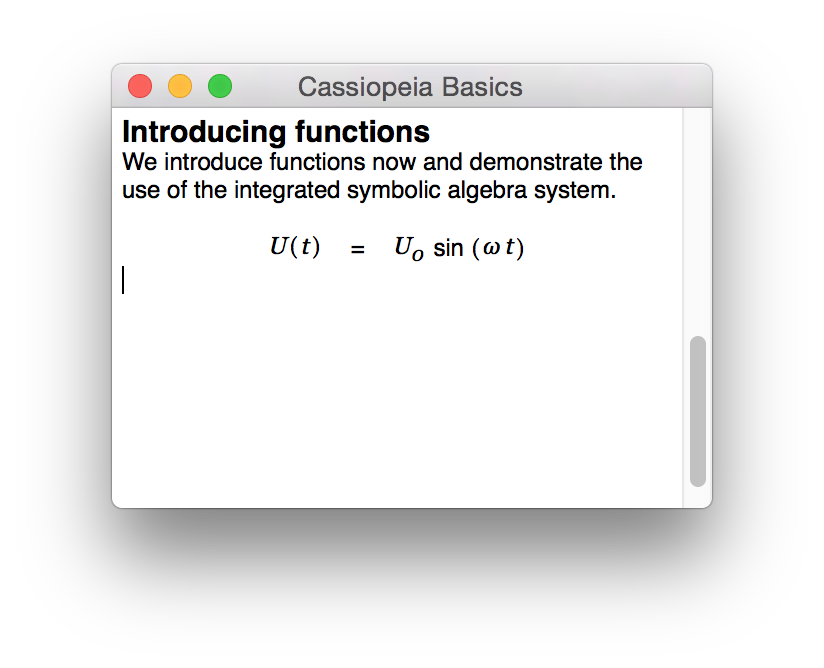 |
 |
Click on Numbered. The inspector closes automatically and the equation is suffixed with a number.
 |
 |
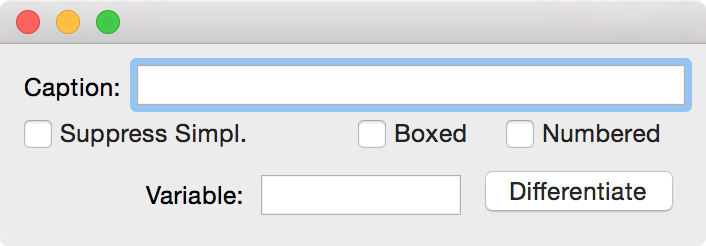
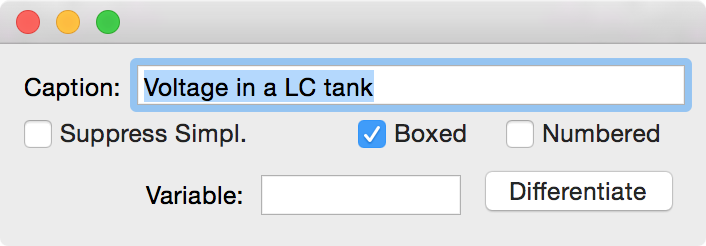
Reopen the equation inspector, remove the numbering and instead enter a caption.
 |
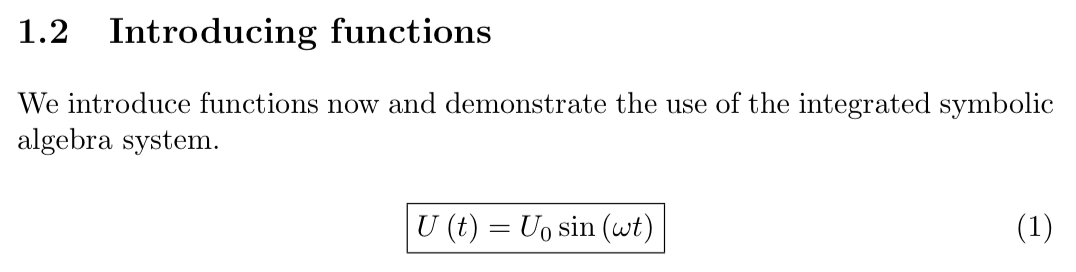
Regenerate LaTeX for the document.
 |
Reopen the equation inspector with a Command-Shift-Doubleclick on the equation and deactiva the box again. Then click on Differentiate. Cassiopeia automatically generates the first derivative of the function.
 |
 |
Plotting functions
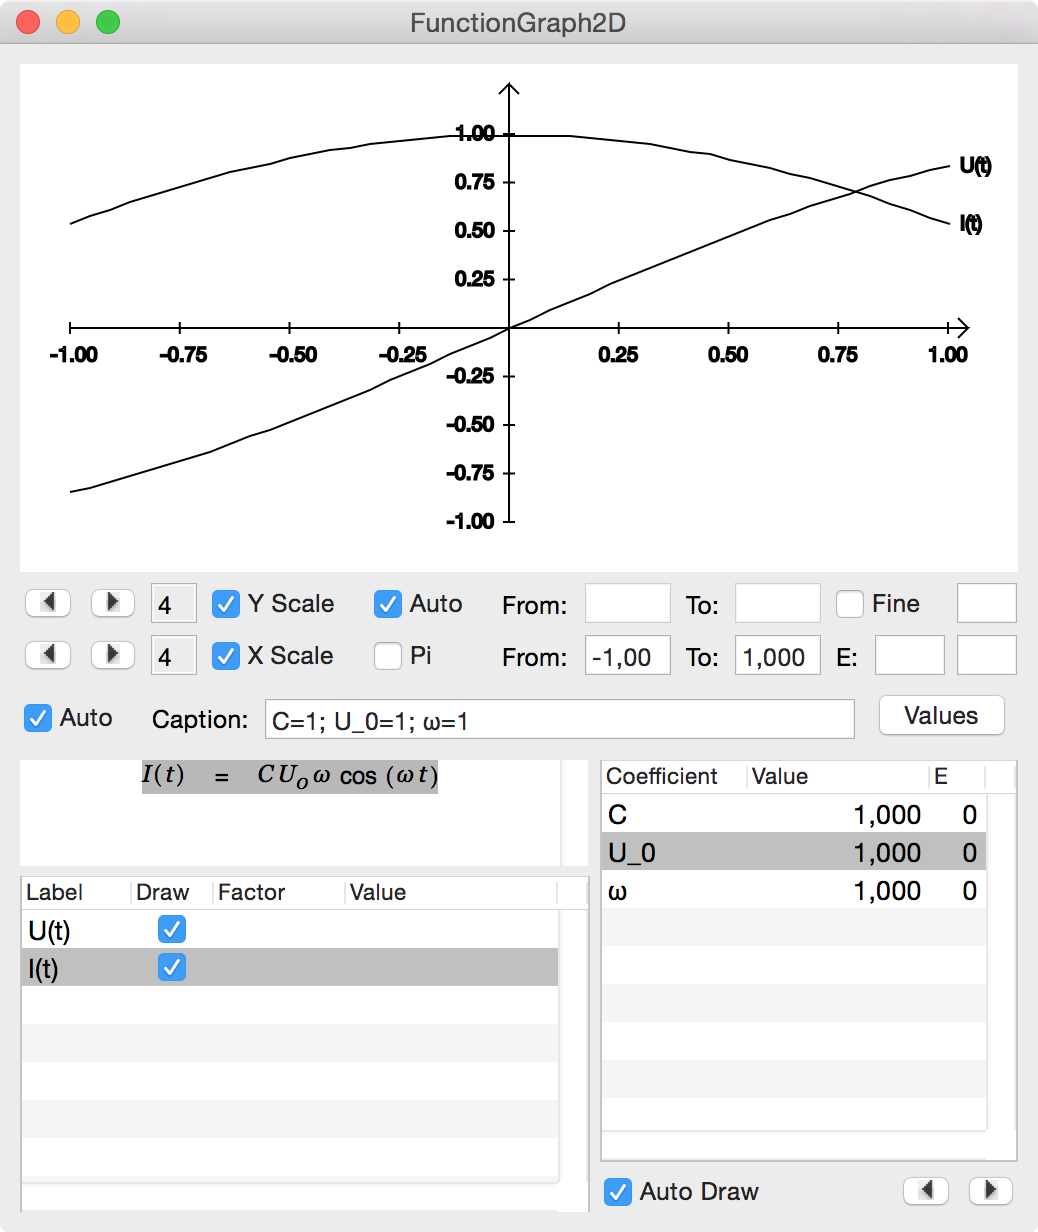
We want to plot the functions entered in the preceeding section now. Choose SDM - FunctionGraph2D from the menu to insert a function graph. The graph inspector is raised.
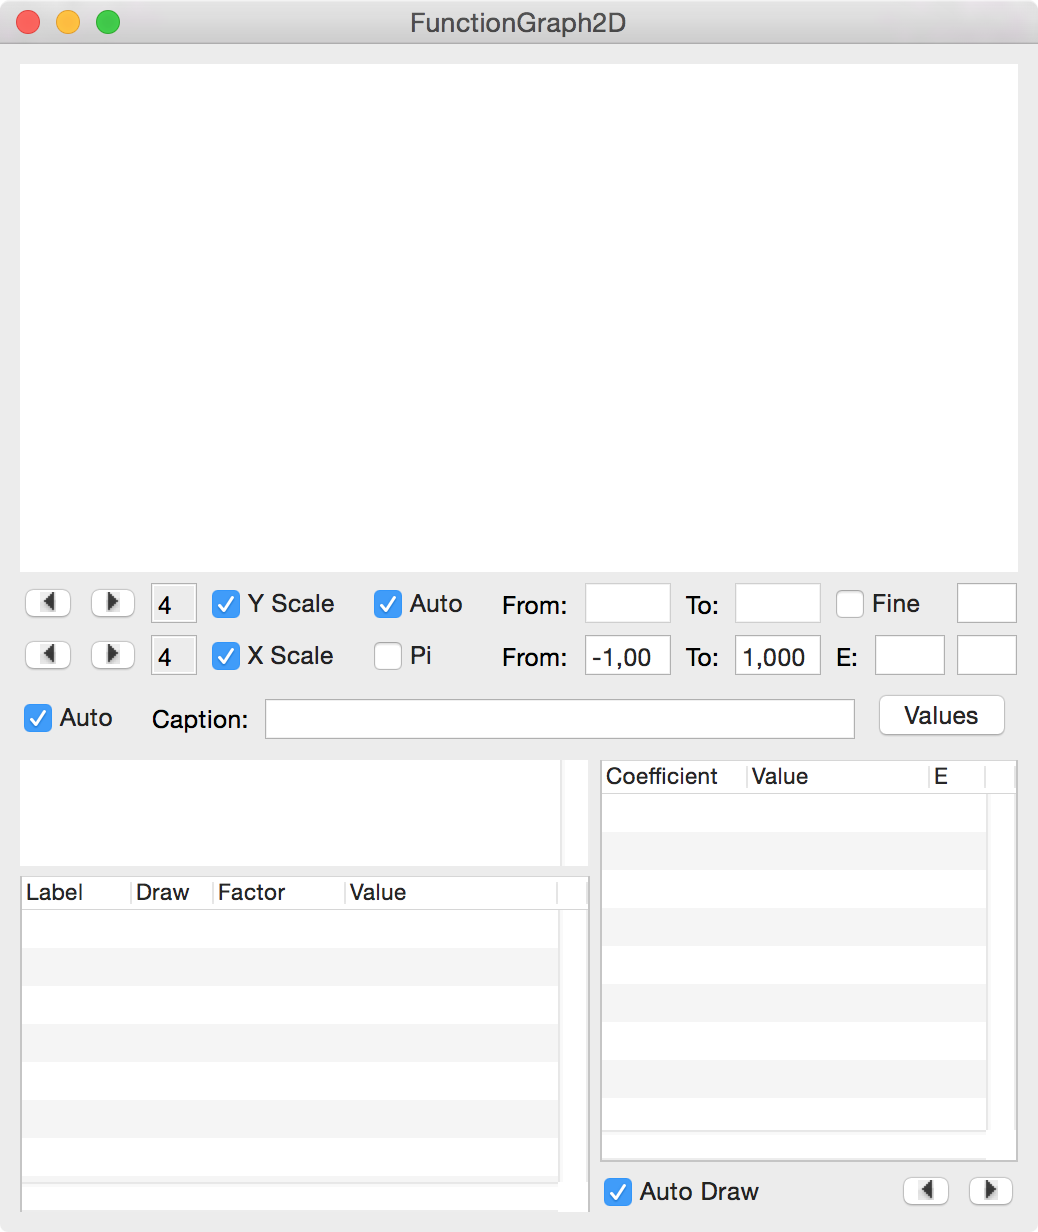 |
Now simply drag the voltage and current functions onto the white textview above the Label, Draw, Factor, Value tableview.
 |
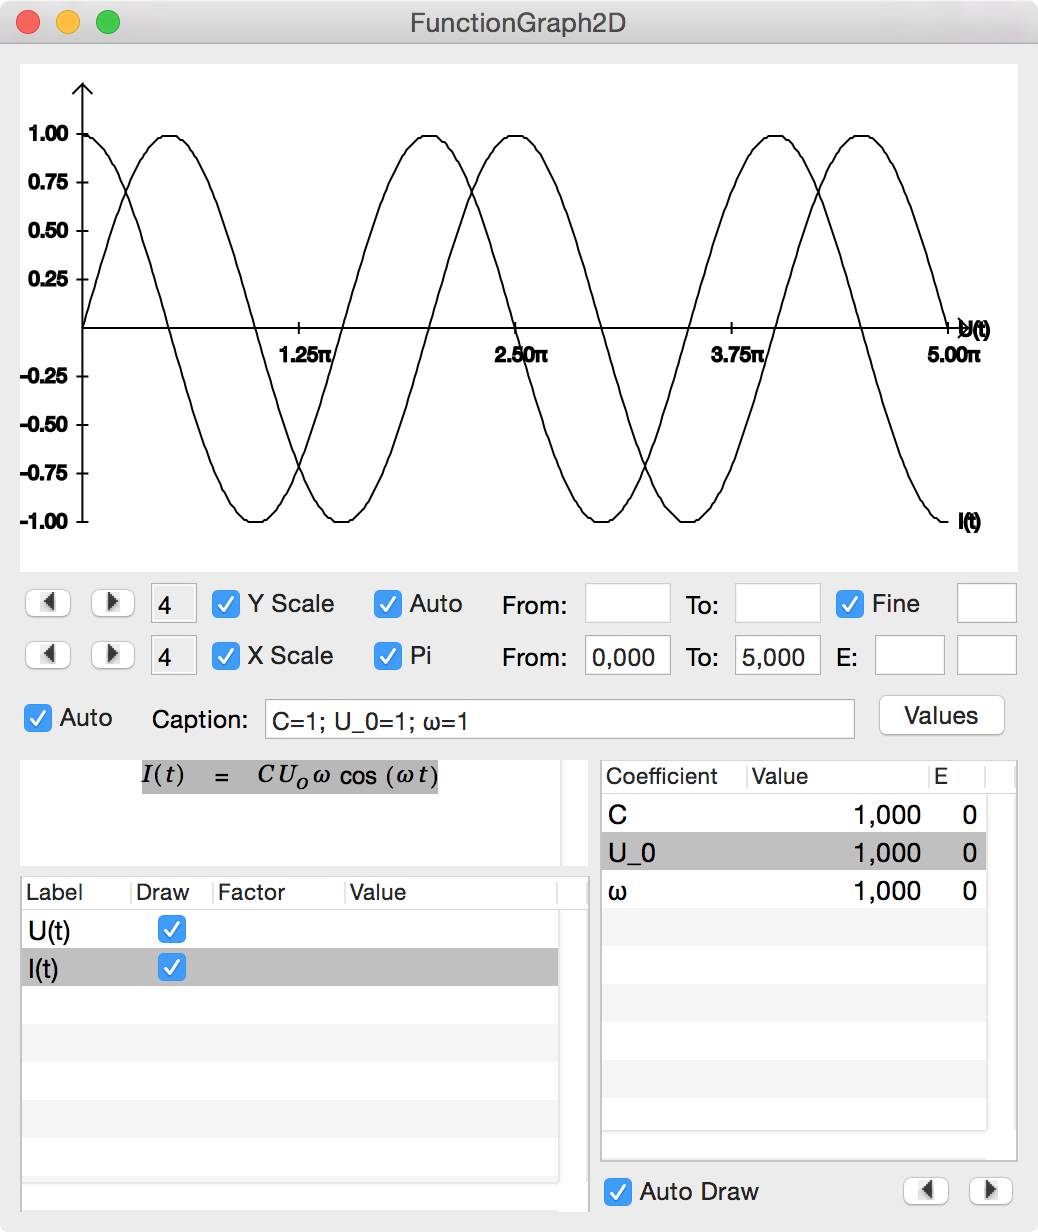
Modify the draw range from 0 to 5 Pi and click on Fine.
 |
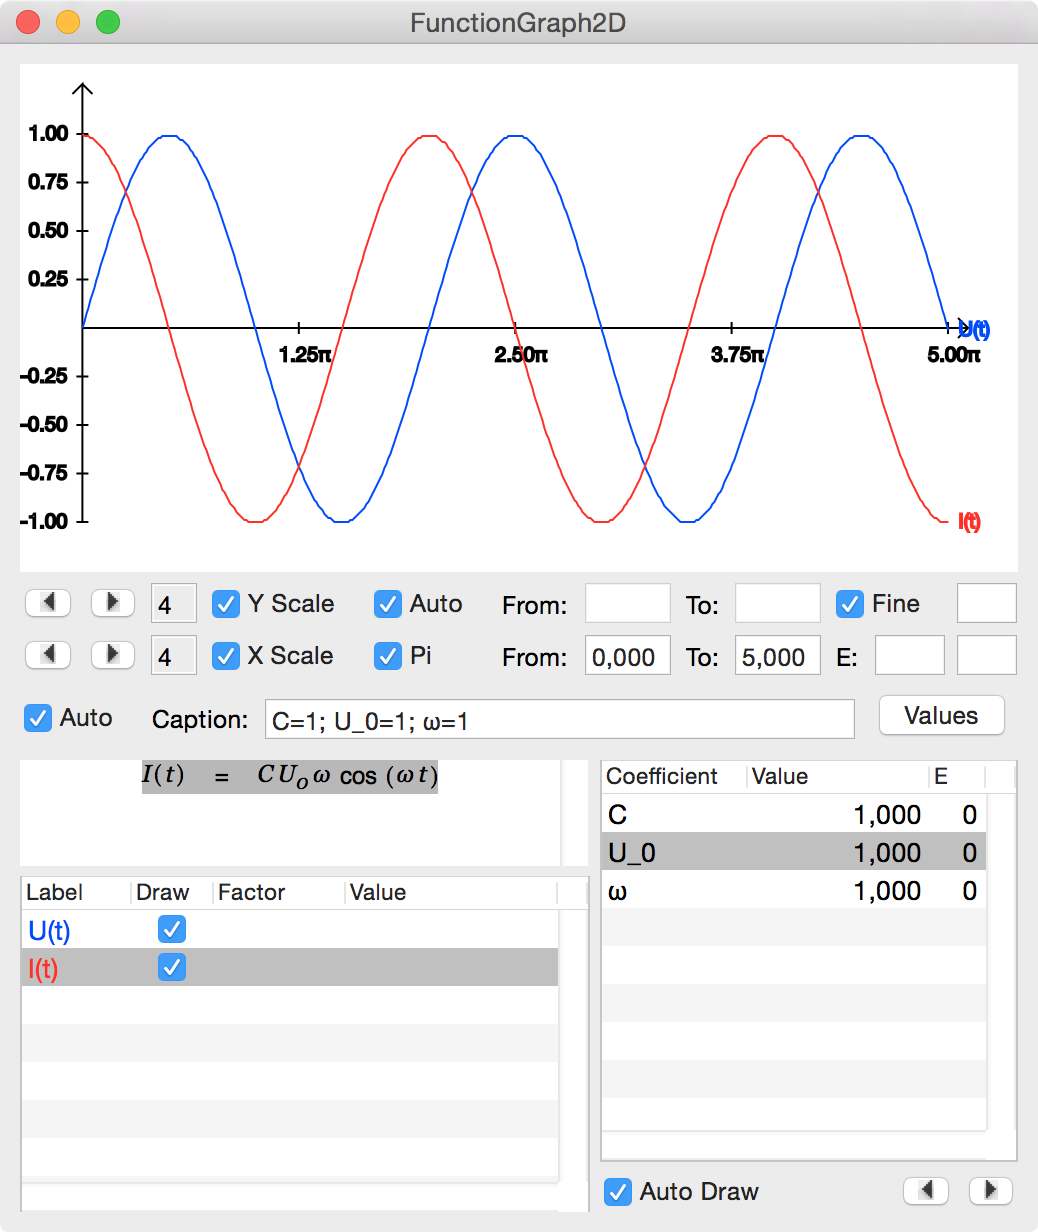
Now open Tools - Colors and drag different colors onto the two functions in the Label, Draw, Factor, Value tableview.
 |
A more detailed discussion about the plotting engine can be found in 2D Graphs.
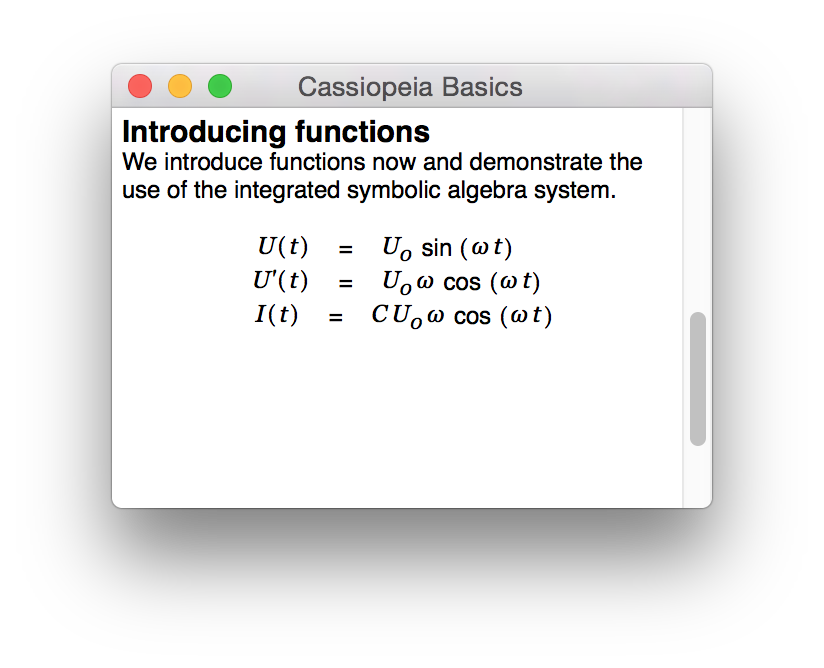
Substituting via drag and drop
We press Command-y and then type Q, (, t, ), =, Q, Ctrl-l 0, <Cursor-up>, <Cursor-right>, e, Ctrl-h, ... to enter the following equation.
 |
Comman-Shift-Doubleclick on this equation to open the inspector and click on Differentiate to calcualte the first (and second) derivative as already demonstrated in an earlier section.
 | |
 |
Create another equation. Make use of Ctrl-f to get the fractions.
 |
Now simply drag the function
 and its two derivatives onto the differential equation.
 |
Alt-Doubleclick on this equation to get rid of superfluous parentheses
 |
and manually simplify the first term.
 |
Vectors and Matrices
Press Command-y to create a new equation and then type F, Ctrl-a v, = m, a, Ctrl-a v.
 |
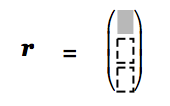
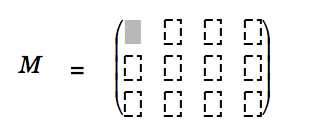
Create another equation and type r Ctrl-a v, = Ctrl-v 3 <Return> to create the following construct.
 |
Click into the first cell and enter some content. Fill the other cells as well.
 |
A 3x4 matrix can be entered with the parameter stroke Ctrl-x 3,4 <Return>.
 |
Please note the UseArrowForVetors entry on the Environment pane of the Cassiopeia prefences panel.
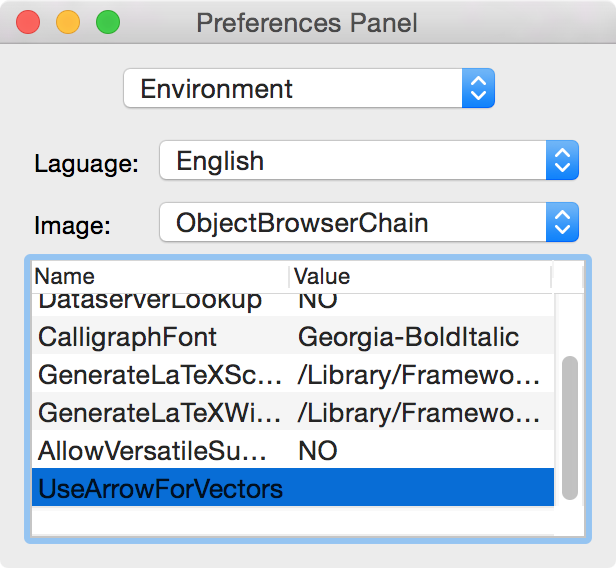 |
Specify YES for the value if you prefer vectors to be drawn with a little arrow on top of the identifier instead of using a bold font (common in many European countries).
 |
A quick reference of symbols and parts can be found in Equation Editor Quick Reference and is also available via the palette (Command-Shift-P).
News
| 23.04.2023 | Cassiopeia 2.9.0 released |
| 05.10.2022 | Cassiopeia 2.8.3 released |
| 29.09.2022 | Cassiopeia 2.8.0 released |
| 08.07.2022 | Cassiopeia 2.7.0 released |
| 14.04.2021 | Cassiopeia 2.6.5 released |
| 10.02.2021 | Cassiopeia 2.6.1 released |
| 26.06.2015 | Word Processor Comparison |
| 24.06.2015 | Updated Documentation |
| 23.06.2015 | Cassiopeia Yahoo Group |
| 18.06.2015 | Advanced Data Security |
| 11.05.2015 | Cassiopeia Overview |
| 08.05.2015 | Exporting to files |
| 14.05.2013 | LaTeX and HTML Generation |
| 08.05.2013 | Example Paper released |
| 26.04.2013 | Co-editing in a workgroup |
| 16.04.2013 | Equation Editor Quick Reference |
| 12.04.2013 | Equation Editor |
| 04.04.2013 | Links and Bibliography |
| 01.04.2013 | Books |
| 30.03.2013 | Documents |
| 28.03.2013 | Simulations |
| 16.03.2013 | 2D Graphs |
| 10.03.2013 | Symbolic Algebra |
| 08.03.2013 | Getting Started |
| 07.03.2013 | Installation and Setup |
White Papers
| 13.10.2015 | 01 Writing documents |
| 15.10.2015 | 02 Using the equation editor |
Youtube
| 08.07.2022 | Installation & Getting Started |
| 14.04.2021 | Animating Wave Functions |
| 26.01.2016 | Keystroke Navigation |
| 22.10.2015 | Equation Editor Demo |
| 19.06.2015 | Equation Editor Tutorial |
| 10.06.2015 | Sections and Equations |
| 09.06.2015 | Getting Started |
| 09.06.2015 | Damped Oscillations |
| 29.05.2015 | Solving equations |
| 13.05.2015 | Privileges and Links |
| 19.06.2013 | Magnetic Field |
| 14.06.2013 | Creating Documents |
| 10.06.2013 | Vector Algebra |
| 30.05.2013 | Differential Simulations |
Contact
Smartsoft GmbH Advanced Science Subdiv.Support: support@advanced-science.com
